 Market sizing, trending, and targeting all depend on data. Marketers understand this – and their sources, Nielsen, Pew Research and AARP have, for many years, provided data food for marketers. And so every tech company ever launched builds its business case on tech adoption trends (and gaps) derived from these sources. So what’s the survey population makeup? Consider Nielsen (global, online, n=30,000); Pew Internet use (US, 2015 n=3004); and AARP (US, 2016, n=1500). These are all declared to be statistically valid samples. But what if the sample size was 3.5 million households, comprising 1% of the US population, as was the case in the last three years of American Community Surveys (ACS) as collected by the US Census Bureau? [Note: per this discussion, a household can have one or more persons aged 65+].
The ACS is quite specific about Internet access mechanisms for households. Could this, would this be interesting for targeting advertising within a geography? Why? Because the data outlines technology device and Internet access types -- down to the geographical level. Oh, and device ownership, for example, smartphones, that can be correlated with age, income, marital status, and multigenerational household? So how has type of Internet access for the households of the 65+ population changed during the two-year period 2013-2015 (see Figure 1)? And what does it mean?
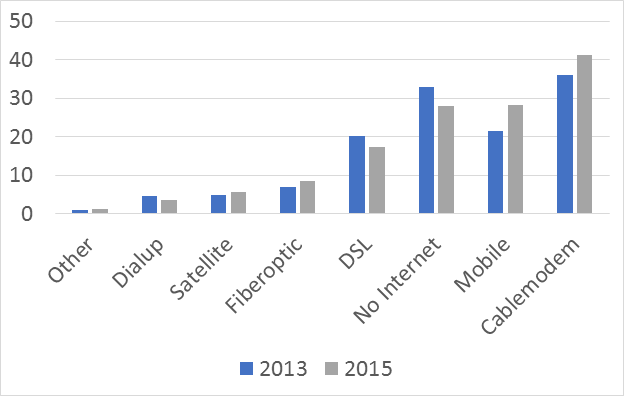
Figure 1 Internet access (%) 2013 vs. 2015, households with person(s) 65+
Cable modem access is growing among older adults. Why? Well, it is described as being faster than DSL -- so that’s compelling. It could easily be sold as part of a $100+/month triple play (or the not-so appealing quad play) offering by a carrier hoping to lock in users with a suite of services. Note the low penetration of Fiber to the home for the 65+ (see Figure 2). Perhaps that not because it is unappealing, but is because as of 2015, only 25% of the US has access to fiber networks -- the fastest Internet access speed.
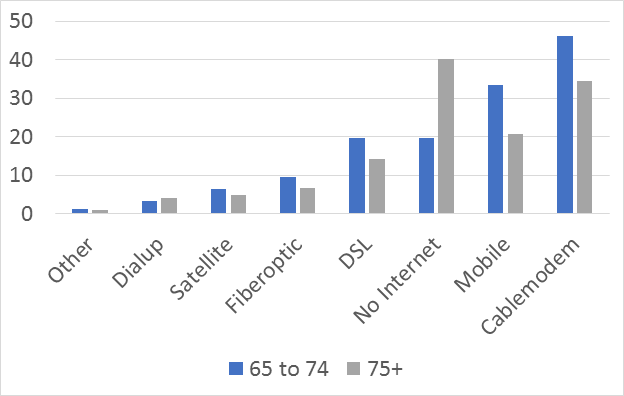
Figure 2 Household Internet access (%) by age group
Who can afford to pay for access? Note that the percentage of household non-Internet use for the 65+ decreased between those two census surveys. Also note that forty percent of the households with someone aged 75+ are not buying what Internet service providers (via any method) and their advertisers, including AARP, are selling. Maybe this can be attributed to the price of Internet access of any type, which is not cheap. Note mobile and Internet access for the $75K income band for the full 2015 population of 47.9 million aged 65+ (see Figure 3). Median income of households that year was $38.5K, $22.9K for individuals -- and $18.6K for those without earnings (jobs). Now for those organizations focused on helping older adults go online -- note that pesky digital divide. And digital health? It's not happening for most older adults, including boomers aged 65-71.
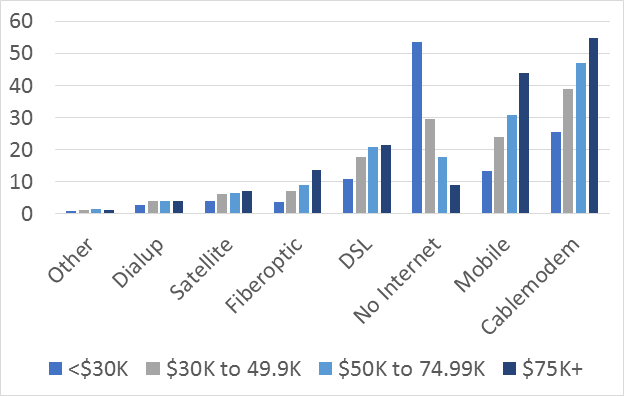
Figure 3 Household Internet for the population aged 65+, % by income range